Data Center Monitoring in 2026: KPIs, Alerts, and DCIM for Reliable and Sustainable Supervision
- Mar 9
- 9 min read

Data centers can’t be managed in the dark.
a clear KPI framework , (
alerting that stays actionable , and (
a DCIM platform that unifies facilities + IT telemetry into a single, reliable supervision layer
Score Group — Là où l’efficacité embrasse l’innovation… We help organizations align Energy, Digital, and New Tech so monitoring becomes a lever for performance and sustainability—not just another dashboard.
Why data center monitoring looks different in 2026
Three forces are reshaping supervision strategies:
Higher density and more volatile loads (AI, GPUs, mixed workloads) increase thermal and power-chain stress—making early anomaly detection essential.
Standardized KPIs are maturing: for example, ISO/IEC 30134-2:2026 (PUE) was published in January 2026, providing updated guidance for measurement and reporting boundaries.
Reporting and transparency expectations are rising. In the EU, the Commission adopted a delegated regulation that requires data centre operators to report KPIs to a European database (with deadlines starting in 2024 and recurring annually) and to publish energy/sustainability information under the recast Energy Efficiency Directive framework (European Commission, 2024).
Result: monitoring in 2026 must support real-time operations and audit-ready KPI reporting, while remaining robust enough to scale across hybrid and multi-site footprints.
KPIs first: build a monitoring model that matches your risks
A sustainable supervision program starts by defining what “good” looks like (service objectives, safety limits, efficiency targets), then mapping each KPI to:
Measurement points (meters, sensors, BMS/EMS signals, IT telemetry)
Boundaries (room, row, hall, site, mixed-use building)
Frequency and aggregation (real-time, 5-min, hourly, monthly)
Ownership (facilities, IT ops, security, sustainability)
Useful reference frameworks include the ISO/IEC 30134 KPI series (resource efficiency KPIs) and resilience-focused KPIs such as ISO/IEC TS 22237-31:2026 (KPIs for resilience), published in February 2026.
Reliability KPIs (what protects uptime)
Reliability monitoring must cover both IT service health and critical infrastructure tolerance (power distribution/supply and environmental control). This includes:
Availability indicators (facility availability, service availability, maintenance impact)
Incident lifecycle KPIs such as MTTD (mean time to detect) and MTTR (mean time to repair/restore)
Power chain readiness (UPS status, bypass, battery health, generator readiness)
Cooling continuity (redundancy state, valve/fan/pump anomalies, thermal excursions)
Cost of failure is not theoretical: Uptime Institute’s Annual Outage Analysis 2024 reports that 54% of surveyed organizations said their most recent significant outage cost more than $100,000, and 16% said it exceeded $1 million (survey year referenced: 2023). The same analysis highlights that many outages could be prevented with better management and processes.
Energy efficiency KPIs (what controls operating conditions and consumption)
In 2026, energy KPIs should be measured consistently and used operationally (not only for annual reports). The essentials typically include:
PUE (Power Usage Effectiveness) using a standardized methodology (see ISO/IEC 30134-2:2026)
Cooling-focused KPIs (e.g., ISO/IEC 30134-7:2023 (CER) for cooling efficiency ratio)
Electrical losses (transformers, UPS modes, harmonics where relevant)
Why it matters: Uptime Institute’s analysis shows industry average PUE has remained broadly flat in recent years, with 2023 industry average PUE reported at 1.58 and a long-running range around 1.55–1.59 (depending on sample and methodology), reinforcing the need for operational efficiency actions rather than one-off projects (Uptime Institute, 2024).
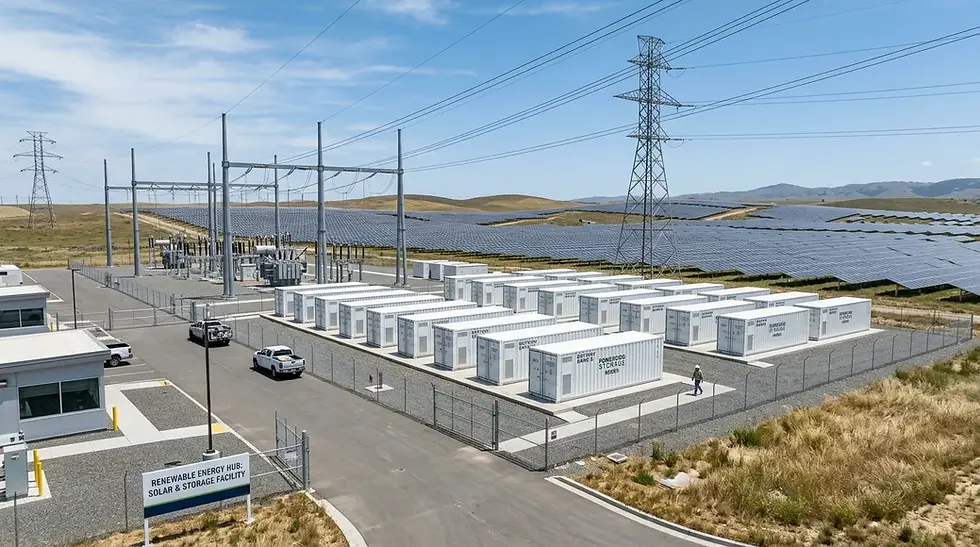
Sustainability KPIs (what proves progress)
Sustainability supervision has moved beyond energy-only reporting. In 2026, common KPIs include:
WUE (Water Usage Effectiveness) for water intensity (ISO/IEC 30134-9:2022)
CUE (Carbon Usage Effectiveness) for CO2 intensity (ISO/IEC 30134-8:2022)
ERF (Energy Reuse Factor) for waste heat reuse (ISO/IEC 30134-6:2021)
Renewable Energy Factor (REF) to track renewable sourcing (ISO/IEC 30134-3:2016)
Water is gaining scrutiny: the Green Grid (through ITI) introduced a Water Usage Impact (WUI) metric to complement WUE by incorporating local water stress (ITI / The Green Grid, 2024).
Operational environment KPIs (what protects hardware and avoids wasted cooling)
Environmental supervision should reference recognized guidance (temperature, humidity, and rate-of-change constraints). For example, NREL’s “Energy Efficient Data Centers” presentation summarizes recommended intake conditions aligned with ASHRAE guidance, including a recommended 65–80°F intake range for typical equipment classes (NREL, 2020). For deeper industry resources, see the ASHRAE Data Center Resources hub and ASHRAE TC 9.9 reference materials (e.g., ASHRAE TC 9.9 reference card).
2026 KPI table: what to monitor, how to use it
KPI | Primary reference | What to measure (practical scope) | Alerting intent (how to make it actionable) |
|---|---|---|---|
PUE | Total facility energy vs. IT energy, with clear boundaries (incl. mixed-use rules if applicable) | Alert on sudden deviations vs. baseline (often reveals metering errors, stuck economizers, controls drift) | |
WUE | On-site water consumption attributable to DC operations (cooling, humidification) normalized by IT energy | Alert on abnormal water spikes and “water with no heat” patterns (leaks, control faults) | |
CUE | Operational emissions intensity, using the chosen emissions factors and reporting boundaries | Alert when carbon intensity rises unexpectedly (tariff/fuel mix changes, generator runs, sourcing gaps) | |
ERF (heat reuse) | Recovered/reused energy vs. total DC energy | Alert on drop in reuse rate during heating demand windows (valves, pumps, heat exchanger fouling) | |
Availability / interruption time | Event impact per infrastructure domain (power, cooling), aligned with your service model | Alert on any loss-of-redundancy state and on repeated micro-interruptions (often early failure signals) | |
MTTD / MTTR | Operational KPI (ITSM/runbook-driven) | Time from anomaly to detection; time from detection to restoration | Alert when MTTD/MTTR trends worsen (tooling gaps, staffing, noisy alerts, weak escalation paths) |
UPS & battery health | Manufacturer + maintenance procedures | Load %, autonomy estimate at current load, test outcomes, temperature of battery rooms | Alert on degraded autonomy, failed self-tests, and thermal excursions impacting battery lifetime |
Generator readiness | Maintenance procedures + compliance requirements | Start reliability, fuel level/quality, ATS behavior, test logs | Alert on failed starts, ATS anomalies, or fuel risks before peak periods |
Rack inlet temperature compliance | Per-rack/per-row intake sensors, not only room average | Alert on localized hotspots and fast rate-of-change events (failed fan wall, blocked tiles, cable baffles) | |
Cooling efficiency ratio (CER) | Energy used to control temperature of DC spaces vs. defined cooling output | Alert on CER drift (fouled coils, poor containment, control loop instability) | |
Capacity headroom (power/cooling/space) | Capacity governance / DCIM model | Committed vs. available capacity by zone, including redundancy constraints | Alert on “hidden saturation” (N+1 constraints, breaker loading, localized cooling limits) |
Security events (cyber + physical) | Policy + SOC/SIEM model | Access control anomalies, camera events, OT/IT security signals, change approvals | Alert on correlated patterns (e.g., badge anomaly + network scan + config change) |
Alerts in 2026: move from thresholds to context
Modern data centers generate massive telemetry. The challenge is not collecting data—it’s producing alerts that trigger the right action with minimal noise.
A practical alerting playbook (that scales)
Start from the decision: for each alert, define the operator action in one sentence (e.g., “restore redundancy”, “protect inlet temperature”, “prevent overload”).
Bind alerts to SLOs and risk states: loss of redundancy, safety limit approach, compliance drift, or customer impact risk.
Prefer “symptom + cause candidates”: a good alert includes evidence (recent trend, affected zone, related sensors) and likely root-cause branches.
Use baselines and anomaly detection where variance is normal: AI workloads make fixed thresholds less reliable; baselines (per hour/day/workload type) reduce false positives.
Attach a runbook: escalation path, checks, rollback steps, and “when to declare an incident”.
Reducing alert fatigue without losing safety
Event correlation: group alarms by dependency chain (utility → UPS → PDU → rack) so operators see one incident, not 50 symptoms.
Maintenance windows and change-awareness: suppress known-impact signals during approved work, but keep “unsafe” alerts active.
Quality-of-signal governance: decommission stale sensors, fix time sync, calibrate meters—bad data creates bad alerts.
Concrete alert scenarios (examples you can implement)
Power chain example:
Detect loss of redundancy when a UPS module goes unavailable while load remains stable.
Correlate with upstream utility disturbances and ATS transfer logs.
Escalate with a “time-to-risk” indicator (how long until the remaining path violates design tolerance).
Cooling example:
Trigger an alert on localized rack inlet temperature excursion, not only average room temperature.
Enrich the alert with airflow indicators (containment door open, differential pressure shift, fan/pump speed anomalies).
Recommend immediate checks (blocked perforated tile, failed fan wall section, stuck damper).
Sustainability example:
Flag abnormal WUE rises (water consumption increases without corresponding thermal load changes).
Route to facilities + sustainability owner so leaks and control issues are handled before monthly reporting closes.
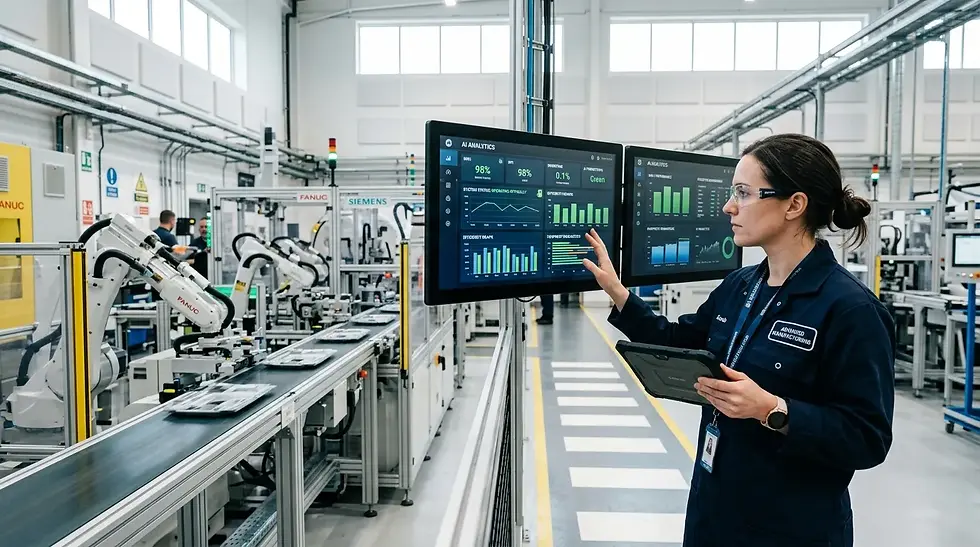
DCIM in 2026: your “single pane” for facilities + IT reality
DCIM (Data Center Infrastructure Management) is widely defined as the convergence of IT infrastructure, operations, and building facilities functions, aiming to provide holistic visibility into performance, energy, equipment, and space utilization (TechTarget, 2025).
In practice, DCIM becomes the operational source of truth for:
Asset & topology (where equipment is, how it’s connected)
Real-time monitoring (power, cooling, environment, alarms)
Capacity planning (power/cooling/space constraints under redundancy rules)
KPI reporting (PUE/WUE/CUE/ERF, trends, audit trails)
Reference architecture: from sensors to decisions
Field layer: smart meters, branch circuit monitoring, PDUs, UPS/gensets, CRAH/CRAC, chillers, leak detection, differential pressure, rack inlet sensors.
Protocols & gateways: SNMP, Modbus, BACnet, OPC UA, Redfish/IPMI—normalized into a common model.
Data platform: time-series storage + event bus + historian for audit-grade retention.
DCIM application layer: topology, dashboards, capacity engine, KPI calculators, alarm correlation.
Workflow integration: ITSM ticketing, change management, notification channels, and reporting exports.
Automation: safe actions (setpoint adjustments within policy, controlled load shifting, scripted diagnostics).
Where AI and smart sensing add real value (without hype)
In 2026, AI is most useful where it reduces uncertainty:
Anomaly detection on multi-sensor patterns (early warning before a threshold is breached)
Predictive maintenance (detecting drift in cooling performance, repeated micro-events, or unstable control loops)
Optimization suggestions with guardrails (e.g., raise setpoints only when intake compliance stays within policy)
At Score Group, this is where our Noor Technology division can contribute with applied AI—especially for anomaly detection and supervised automation—aligned with your operational constraints (see our focus on Artificial Intelligence capabilities).
Regulatory and stakeholder readiness: monitoring must be report-ready
Even when you are not directly in scope of a specific regulation, 2026 is clearly a “proof era”: customers, auditors, and internal governance increasingly expect traceable evidence (what was measured, how it was calculated, and what actions were taken).
Two concrete signals to consider:
EU KPI reporting scheme: the European Commission’s 2024 announcement details recurring KPI reporting deadlines and publication expectations under the recast Energy Efficiency Directive context (European Commission, 2024).
National requirements referencing PUE: for example, Germany’s Energy Efficiency Act implications for data centers have been summarized with staged PUE requirements and management system obligations (White & Case, 2023). This is a strong indicator of the broader direction: KPIs are becoming enforceable targets.
How Score Group supports reliable and sustainable supervision
Score Group acts as a global integrator across three pillars—Energy, Digital, and New Tech—to turn monitoring into measurable performance.
Digital (Noor ITS): data center design/optimization and infrastructure supervision approaches aligned with operational continuity. Explore our positioning on Data Centers.
Energy (Noor Energy): energy governance and optimization that make PUE/WUE/CUE initiatives operational (not theoretical). See Energy Management.
New Tech (Noor Technology): IoT + AI to reduce alert noise, detect anomalies earlier, and support data-driven decisions (see AI for anomaly detection).
Because supervision is a 24/7 discipline, we also structure operational continuity through Managed Services when clients need long-term monitoring, maintenance coordination, and continuous improvement.
Implementation roadmap (no filler, just what works)
Define the operational scope: sites, rooms, tenants, workloads, criticality tiers, reporting obligations.
Map measurement points: electrical single-line diagram + cooling topology + sensor placement (rack-level where needed).
Standardize KPI calculations: adopt ISO methodologies where applicable (PUE/WUE/CUE/ERF) and document boundaries.
Design alerting with runbooks: correlation rules, severity model, escalation, maintenance windows, post-incident review.
Integrate workflows: tickets, change approvals, security monitoring. For many organizations, cyber resilience must be supervised alongside facilities (see Cybersecurity services).
Operationalize continuous improvement: monthly KPI review, drift detection, sensor audits, and sustainability reporting cadence.
FAQ: Data Center Monitoring in 2026
What are the most important KPIs to monitor in a data center in 2026?
Prioritize KPIs that directly reduce risk and support reporting: reliability indicators (availability, MTTD/MTTR, loss-of-redundancy states), resource efficiency KPIs (PUE, WUE, CUE, ERF), and capacity headroom (power/cooling/space under redundancy constraints). In 2026, it’s also smart to align with recognized standards for consistent calculation—such as ISO/IEC 30134 for efficiency KPIs and ISO/IEC TS 22237-31:2026 for resilience-oriented KPI definitions. This makes internal decisions faster and external reporting more defensible.
How is DCIM different from “traditional monitoring” tools?
Traditional monitoring often focuses on a single domain (IT, network, or facilities). DCIM is intended to unify facilities + IT realities—assets, topology, power, cooling, space, alarms, and capacity planning—into one operational model. TechTarget describes DCIM as the convergence of IT infrastructure, operations, and building facilities functions, aiming for holistic visibility and efficiency. In 2026, this convergence matters because many incidents span domains (power/cooling impacts IT), and sustainability KPIs require facility-grade metering and traceability.
What’s the best way to set alert thresholds for temperature, power, and cooling?
keep safety limits aligned with recognized guidance and equipment constraints, (
build baselines for normal behavior by zone and workload, and (
alert on rate-of-change and correlated anomalies (e.g., inlet temperature rise plus fan/pump anomalies). For temperature, rack inlet conditions matter more than room averages; sources like NREL summarize recommended intake ranges aligned with ASHRAE practices. Avoid “one threshold fits all” in 2026—AI workloads and containment strategies change the normal operating envelope
How can monitoring improve sustainability without risking availability?
Start with observability and control stability: you can’t optimize what you can’t measure consistently. Then apply guardrails: only automate efficiency actions (setpoints, airflow, staging) when rack inlet compliance remains within policy and redundancy is preserved. Use standardized KPIs (PUE/WUE/CUE/ERF) to measure impact and detect drift, and treat any “efficiency gain” that reduces fault tolerance as a risk event. The strongest programs connect energy KPIs to operational states—so operators see when efficiency changes increase incident probability.
What now?
If you want monitoring that is reliable, audit-ready, and sustainable in 2026, align KPIs, alerting, and DCIM under one operating model. At Score Group, we bring together Noor ITS (data center & digital infrastructure), Noor Energy (energy performance), and Noor Technology (AI/IoT) to design supervision that improves daily operations and supports long-term sustainability objectives. Explore our data center approach via Noor ITS Data Centers and our Managed Services to operationalize it over time.